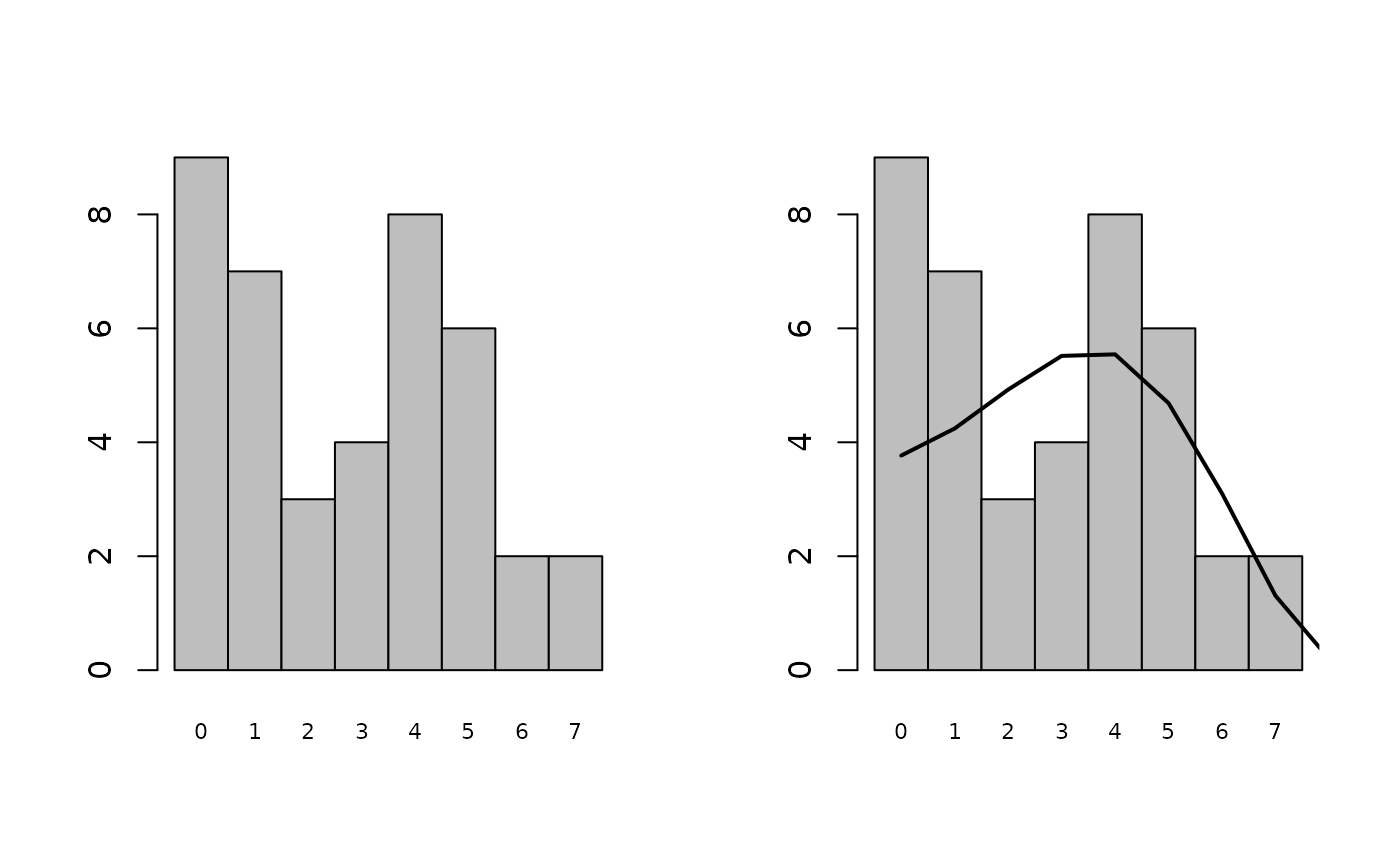
Barplot in Preston style of an abundance dataset
preston_plot.RdThis function first sorts abundances into octaves, and then plots the resulting distribution.
Arguments
- abund
vector containing the number of individuals per species
- expected
vector containing the expected number of species per octave
- ...
further graphical arguments that can be passed to
barplot()
Examples
  theta = 10
  m = 0.1
  J = 1000
  I = m * (J - 1) / (1 - m)

  abund <- generate.ESF(theta, I, J)
  par(mfrow = c(1,2))
  preston_plot(abund)
  abund.expect <- expected.SAD(theta, m, J)
  preston_plot(abund, abund.expect)
